
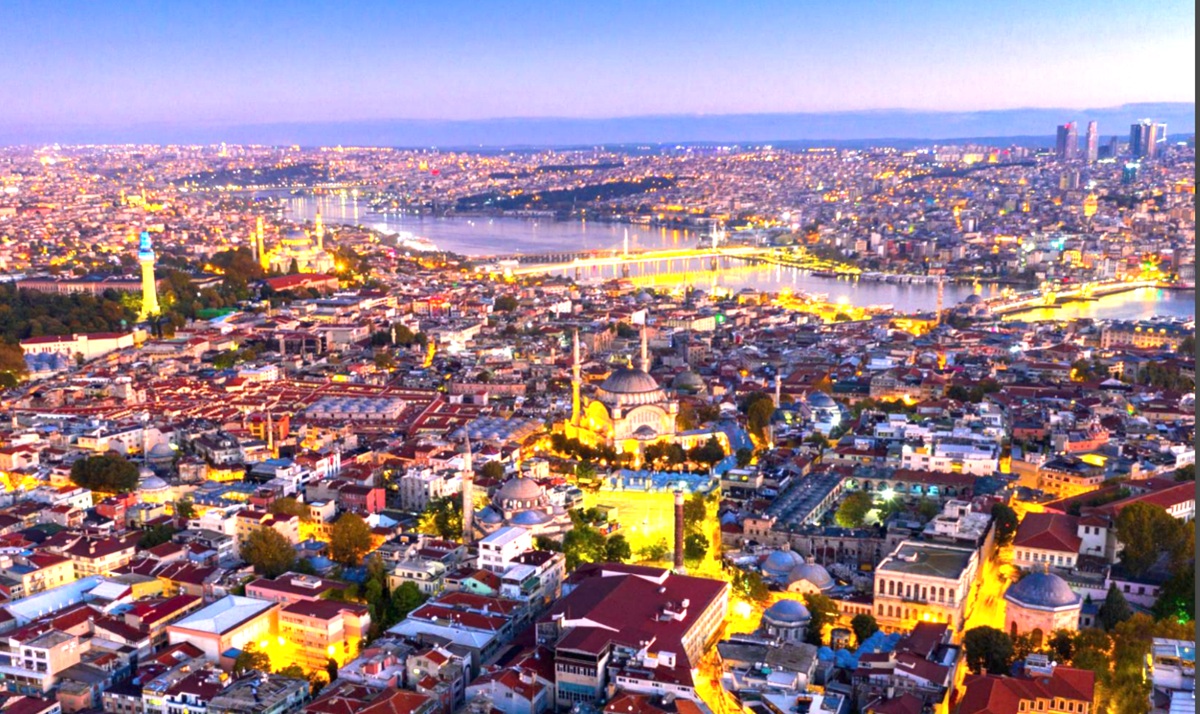
Istanbul, Turkey tops the list of the most-congested urban areas for the second straight year in the Inrix 2025 Global Traffic Scorecard. Traffic delays jumped 12% over 2024 to 118 hours lost, the mobility analytics firm concluded.
The typical U.S. driver lost 49 hours to traffic congestion, a six-hour jump over 2024, which resulted in $894 worth of time lost per driver. In the U.K., drivers lost an average of 59 hours commuting to work, down three hours from 2024.
Congestion costs U.K drivers on average £822 (PPP) in lost time, whereas a typical German driver lost 47 hours in traffic jams, a four-hour increase from 2024, equal to 750 € (PPP) per driver, said the report from Bob Pishue, transportation analyst at Inrix.
Congestion cost the U.S. more than $85 billion in 2025, an 11.3% increase from 2024. By comparison, U.K. drivers lost £11.0 billion, down by 5.6% from 2024, while congestion cost drivers in Germany 5.3 billion € in time lost, up 8.2% from the prior year.
In the U.S., Chicago took the top spot with 112 hours lost, costing the typical driver $2,063 in lost time, and the city as a whole $7.5 billion. In the U.K., London remained No. 1 despite a 10% reduction in delay from 2024.
Drivers there lost about 91 hours to traffic in 2025, equal to £1,252. Across London, this adds to £5.2 billion in lost time. In Germany, Cologne took the top spot with 67 hours in lost time, equal to £919 per driver and 188 million € to the city.
Truck trips across the U.S.-Canadian border are down 4.5% between January and August. Inrix truck trips are strongly correlated with truck border shipments counted by the Customs and Border Patrol, ensuring a quicker, statistically sound way to monitor U.S. trade policy impacts. Inrix expects a slight decrease through Q3 during the U.S. government shutdown, which ended in November.
The big picture
The 2025 Inrix Global Traffic Scorecard includes transportation data and trends among the 942 urban areas analyzed worldwide. The findings provide road authorities, transportation planners, engineers, policymakers, and the public with the ability to monitor and measure traffic in their respective areas.
Traffic is the movement of people, goods and services on the road network. Traffic congestion occurs when demand for road travel exceeds the supply of road space, leading to increased delays and costs associated with congestion. While growing traffic volumes indicate increasing economic activity, the negative externality of traffic congestion has a negative impact on the economy.
Of the urban areas studied, 62% (585) saw increased traffic delays compared to 2024, while 26% (245) experienced a reduction in delay. About 12% (111) of urban areas observed no significant change in traffic congestion levels compared to 2024.
In the U.S., these delays cost the typical driver more than $894 in lost time. Across the country, this means more than $85 billion was lost to traffic jams.
The typical driver in the U.K. and Germany, on the other hand, lost £822 and 750 € to traffic jams (Purchasing Power Parity, PPP), respectively. Congestion cost the U.K. as a whole £11.0 billion, while Germany lost 5.3 billion €.
Traffic trends
Interestingly, some large, dense urban areas saw no significant increase in congestion, and even some reductions. In North America, New York, NY, Los Angeles, CA, and Toronto, ON saw decreases in traffic delays. In Western Europe, a similar pattern emerged with
London, U.K. and Paris, FR. Yet urban areas in Germany and Italy tended to have growing traffic delays. In Asia and the Middle East, traffic congestion mostly increased, save for a few urban areas like Jakarta, Indonesia
Fortunately, traffic fatalities in the U.S., U.K. and Germany continue to sit at or below their pre-COVID lows, though it took until the first half of 2025 to solidify. Due to the U.S. Government shutdown, the latest data available is from H1 2025.
The year saw major policy shifts in U.S. transportation that are noteworthy. New York, NY, for example, has continued to run the first cordon-based tolling program in the United States. While opposition was strong, and the tolling program remains under federal pressure, it continues to operate.
In addition, the Trump Administration threw a wrench into the California High Speed Rail program by revoking $4 billion in grant funding. In some states like California and Illinois, public transport agencies averted their respective fiscal cliffs by securing state money to spend on transit. This continues to signal that state transportation tax and fee sources will be the primary source of transportation revenue going forward for the majority of the population.
Over the past decade, traffic fatalities in the United States have continued to rise, from 32,893 in 2013 to 43,230 in 2021, at the height of the COVID-19 Pandemic. Since then, traffic fatalities and fatality rates have slowly declined but still hovered above their 2024 level – demanding attention from all levels of government and the private sector.
According to the latest statistics, NHTSA (National Highway Traffic Safety Administration) estimated that in the first half of 2025, 17,140 fatalities occurred on U.S. roadways, similar to numbers seen in 2019 and 2020.
Besides the actual fatality numbers, Inrix also sees that the fatality rate has dropped in the first half of 2025. According to the latest data, the fatality rate fell from 1.16 in H1 2024 to 1.06 in H1 2025.
Further, the fatality rate has now hit pre-COVID levels, falling from a high of 1.33 fatalities per 100 million VMT in H1 2021.
Natural disaster traffic patterns show effectiveness of warnings
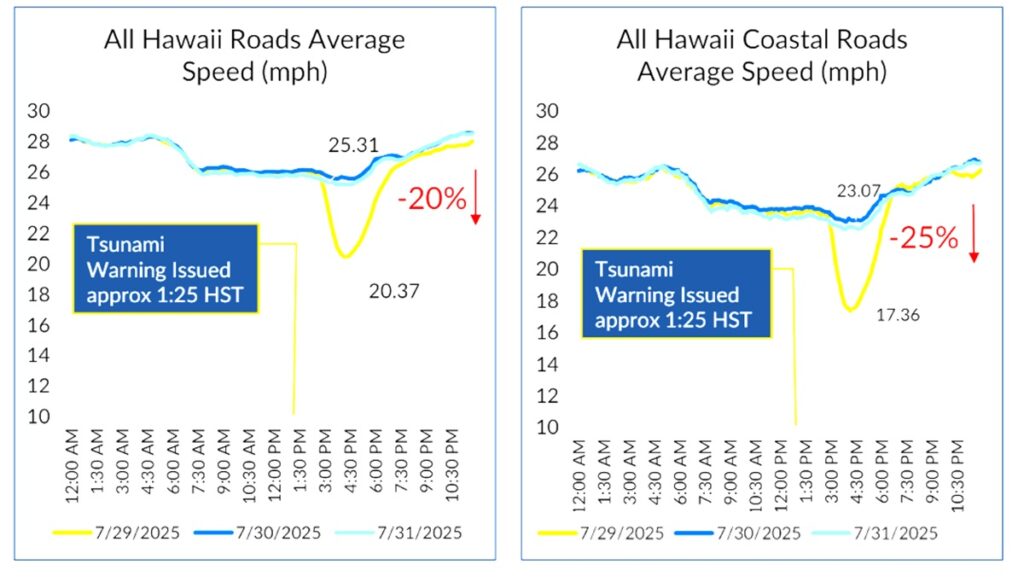
On July 29, 2025, an 8.8 magnitude earthquake struck off Russia’s eastern coast at 7:25pm EDT (1:25pm HST). Tsunami advisories were sent to the western coastal states of the
United States and Hawaii, while a Tsunami Warning was issued for parts of California.
Hawaiians are required to evacuate under Tsunami Advisories; therefore, an adequate road and highway network is critical to the movement of people and goods during natural disasters. Inrix analyzed the Tsunami Advisories and Warnings along the country’s Pacific coastlines.
Inrix analyzed trips to and from the California Coast to analyze whether travelers hit the road after the Tsunami Warning was issued. It found that overall trip trends across the coast do not signify any significant shifts in travel behavior. Travel speeds around Washington’s coastline saw minimal change as well.
Hawaii, however, due to mandatory evacuations, saw significant shifts in traffic patterns and behavior. To start, travel speeds dropped 20% beginning at 2:30 pm, gradually returning to normal at approximately 7:30 pm. Further, average speeds on coastal roads dropped 25% in the hours after the Tsunami Advisory was issued.
When the U.S. trades with Canada or Mexico, the vast majority of trade flows are served by trucks rather than other modes. Trucks carry 56% ($423 billion) of U.S.-Canada trade flows and more than 72% ($1.0 trillion) of trade flows with Mexico. Together, trucks carry nearly two-thirds of all freight flows in North America. In order to gauge trade policy or view industry-specific impacts of tariffs, monitoring what amounts to more than $1.4 trillion in trade is critical to track and understand the market’s reaction.
Upon entering office in January 2025, President Donald Trump imposed trade tariffs on other countries, requiring exporting countries to pay a duty on some products crossing the U.S. border. On February 1, 2025, President Trump announced his plan for a 25% tariff on Canada and Mexico, which partially went into effect on March 4, 2025. Throughout Spring 2025, the U.S. added automaker import tariffs while Canada threatened retaliation and imposed tariffs on the U.S.
Yet by September 2025, Canada dropped most retaliatory tariffs, though some tariffs on automobiles and commodities still stand. Below is both the Inrix Truck Count and the Border Patrol Truck Counts between January – August 2025.
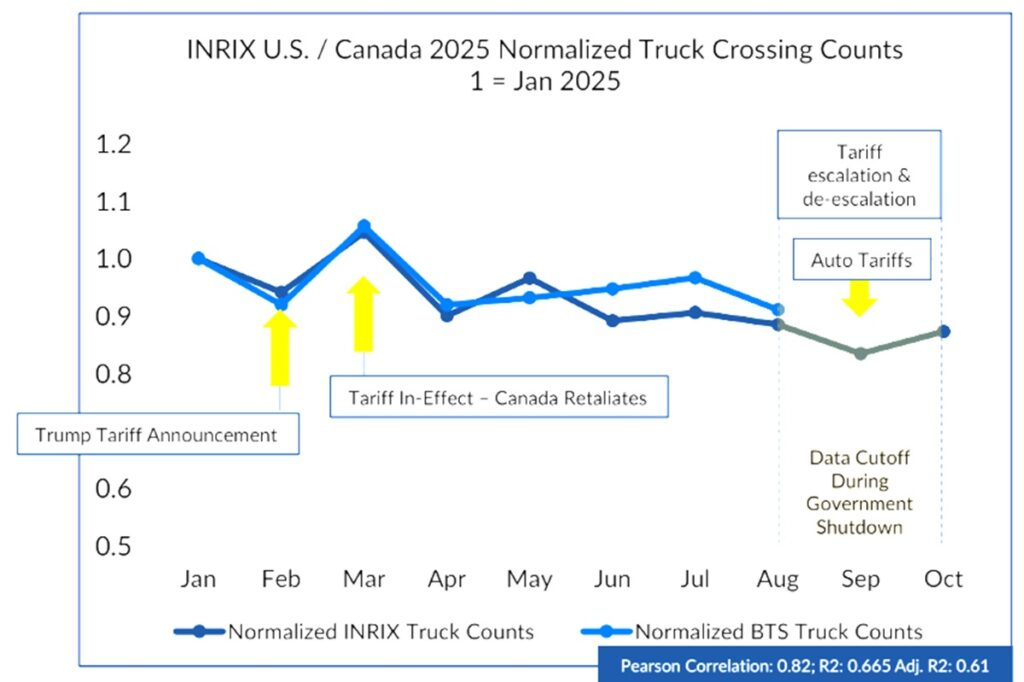
In March, Inrix saw a sharp increase in truck crossings between the U.S. and Canada, likely in preparation for tariffs and the projected higher prices that result. Then, as tariffs went into effect and negotiations got ironed out, trade activity largely flatlined. Per the Customs and Border Patrol crossing counts, the number of trucks crossing the border dropped 4.5% in 2025 over the same period last year (January-August.)
Unfortunately, however, data releases slow, or even stop, during a federal government shutdown. That data gap left analysts searching for other high-quality sources to help in their decision-making. Inrix estimated a slight drop further through October 2025. Having up-to-date, high-quality information helps businesses make key decisions for their clients.
Monitoring Inrix Truck Trips allows investors, market analysts, and manufacturers insights into macro trends spanning multiple industries.
Data and methodology
Inrix has been doing this report for more than 20 years. Data sources come from a variety of places, including GPS probes, loop detectors, cities/states, and trucking and delivery fleets.
The Inrix 2025 Global Traffic Scorecard utilizes an up-to-date methodology to better understand movement in urban areas across the world. The 2025 Scorecard continues to include travel delay comparisons, last-mile speeds and travel trends based on the dynamic commuting patterns within each metro area, providing unique insights into each urban area’s unique commuting characteristics.
Commute times are calculated by looking exclusively at the time it takes to get to and from major employment centers within an urban area from surrounding commuting neighborhoods.
Inrix’s newest methodology includes accurate estimates of commuting distances using actual, observed trips. Unlike other calculations that assume a certain distance or summarize all roads in an area, the 2025 Scorecard utilizes precise calculations to determine the most popular commute routes and their travel speeds, reflecting the typical
commuter’s experience on the roadway.
Economic costs are calculated based on the following hourly values of time, which were based on the U.S. Federal Highway Administration’s Revised Departmental Guidance on Valuation of Travel Time for Economic Analysis, 2016, adjusted for inflation: $18.42 per hour in the U.S., £13.76 per hour in the U.K. and 13.71 € per hour in Germany. Individual urban areas may have higher or lower values of time depending on local economic conditions. The values have been converted to the local currency based on purchasing power parity (PPP).
The 2025 Scorecard values time loss by analyzing peak speed and free-flow speed data for the busiest commuting corridors and sub-areas as identified by origin and destination patterns unique to that area.
Employing free-flow data enables a direct comparison between peak periods and serves as the basis for calculating time loss. Total time lost is the difference in travel times experienced during the peak periods compared to free-flow conditions on a per-driver basis. In other words, it is the difference between driving during commute hours versus driving at night with little traffic.
Data used to complete the 2025 Scorecard spans from 2023 through Q3 2025. Fourth-quarter estimates are calculated based on historical and seasonal trends for each urban area. The Scorecard incorporates multiple years of data for a complete and comprehensive look at congestion and mobility. A multi-year approach enables the identification of trends in the world’s largest urban areas and provides a basis for
comparison.
The “Busiest Corridors” list incorporated observed trip volumes along thousands of corridors across the U.S., U.K., and Germany, allowing Inrix to scale delay to determine which roads not only have the most congestion for the typical driver, but also how many travelers are affected by that specific roadway’s congestion. Selection of the busiest corridors is based on scaled delay, while time lost at peak periods is the height of delay at the peak hour specific to each corridor.
Global analysis and ranking of the busiest traffic cities
Of the top 100 urban areas, Inrix saw an increase in year-over-year delays in 68, while 26 saw fewer delays and six areas were unchanged.
Istanbul, Mexico City, Chicago, New York, and Philadelphia comprise the most-congested urban areas in the 2025 Global Traffic Scorecard by Impact Rank (IR). The IR captures the
aggregate influence of congestion relative to population.
These results are due to their large populations and the increasing vehicular demand on their respective road networks. As the demand for vehicular travel continues to grow faster than the supply of roadway, traffic congestion and delay tend to grow.
On the individual commuter level, hours lost reflect the impact of congestion on the typical commuter on the roadway. In terms of hours lost, Istanbul, Chicago, and Mexico City drivers experienced the most delay, at 118, 112, and 108 hours, respectively.
Big movers in 2025 include Philadelphia, PA, moving up 8 spots from 13th in 2024 to 5th in 2025. Dublin, Ireland, moved up four spots to 11th. Yet urban areas in Turkey made the biggest jumps into the top 25, with Ankara and Izmir making their debut on the list at 20th and 21st, respectively. It’s also notable that some of the biggest cities in the U.S. and Europe fell in the rankings, with New York, Los Angeles, London, and Paris each falling two spots in 2025. Warsaw, Poland, fell off the top 25 list, landing 30th in 2025.
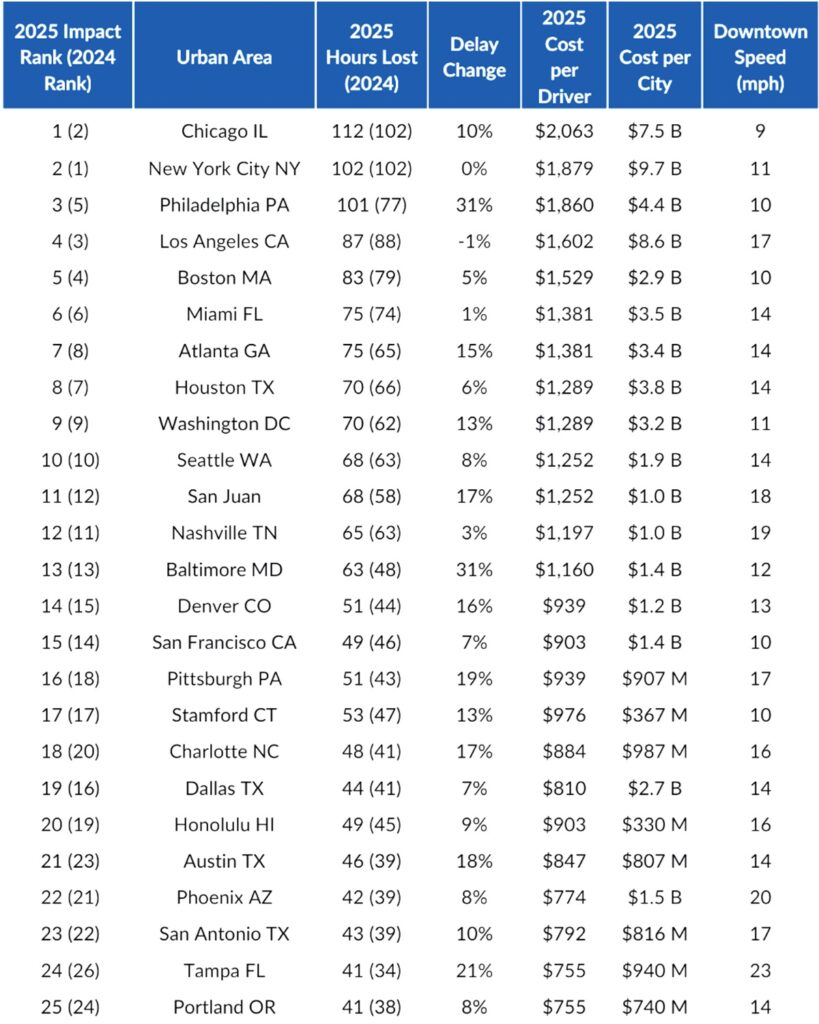
U.S. analysis of the busiest traffic cities
Time lost was 49 hours, up six from 2024. The cost per driver was $894, up $91 from 2024. And the cost to the country was $85.8 billion.
In 2025, Chicago (112 hours lost), New York (102), and Philadelphia (101) took the top spots in the United States Impact Ranking. Chicago overtook New York as delays in the
Windy City jumped 10% year over year, while the delay in the New York Urban Area remained flat.
Both Baltimore and Philadelphia saw the largest percentage increases in the top 25 with both increasing 31% over last year.
The changes pushed Philadelphia up two spots while Baltimore remained at 13th. Double-digit percentage increases were seen in 13 of the top 25 urban areas.
New York particularly stood out as the city implemented congestion pricing this year. Five New York roads made the top 25 busiest corridor list in 2024, of which only one remains in 2025, showing changes in demand and congestion have shifted significantly since the congestion pricing program implementation. While Inrix has seen slowdowns in some in
other dense Western cities like London and Paris, congestion pricing likely played a role in a regional context.
Traffic congestion continued to mount nationwide, causing the typical driver to lose 49 hours in 2025 due to traffic jams, up six hours from 2024, increasing the cost of congestion to $894 per driver, equal to an 11% increase over 2024.
Across the country, drivers lost around 4.7 billion hours due to traffic last year, equal to about 2.2 million full-time jobs worth of productivity, at 2,080 hours per job per year. This cost the country nearly $86 billion in lost time.
As of August 2025 (the last updated data prior to the government budget shutdown), transit ridership was up a modest 3% over 2024 levels, with 5.1 billion transit trips taken since the start of the year. However, transit ridership continued to lag pre-COVID-2019 levels by 20%, indicating that remote work is still competing with transit trips as a commute mode.
Top 25 busiest corridors in the U.S.
For another year, Interstate 95 Southbound through Stamford, CT, takes the top spot for the busiest corridor in the U.S. Busiest Corridor rankings for 2025. The stretch between Compo Road S and Indian Field Road resulted in large traffic delays for travelers during the 8:00 AM commute hour in 2025. Taking that road every weekday during the peak hour would result in a driver losing about 133 hours to traffic congestion in 2025 alone, though this is slightly down from 2024, when drivers lost 150 hours to traffic congestion.
While Northbound I-95 through that section took second place at 94 hours lost, other notables include the third-ranked Brooklyn-Queens Expressway in New York. Drivers on that corridor lost 93 hours to congestion at 4:00 PM last year alone. Orlando’s I-4 Eastbound from Anderson Expressway to World Drive took fourth at 91 hours lost during the 5:00 peak hour, while the Bay Area’s I-680 EB from Mission Boulevard to Scotts Corner came in at 90 hours lost at 4:00 PM.
Conclusions

Traffic congestion around the globe grew in 2025. Sixty-two percent of urban areas analyzed had upward growth in delay, versus 55% in 2024. Delays generally rose across the U.S., Italy, and Germany, and Asia, while delays remained similar or less than 2024 levels in France and the U.K.
Some Western metropolises, like Los Angeles, Toronto, London and Paris, saw traffic delays recede, though all still remain some of the most congested in their respective countries. The U.K. got a bit of a reprieve from traffic pain, as the typical driver gained three hours back from last year, to sit at 59 hours lost. As a result, the economic cost of delay shrank £653 million to £11.0 billion. Delays in Germany, on the other hand, resulted in an 8% increase in economic costs to 5.7 billion €.
Traffic fatality numbers improved enough to reduce the fatality rate to pre-COVID levels. For the last four to five years, traffic fatalities have increased significantly on U.S. roadways. Additionally, a lot of cities worked to reduce speed limits on city streets – New York continues their implementation of “Sammy’s Law,” aimed at reducing speeds and associated injuries and fatalities.
Transportation policymakers in the U.S. will soon have a surface transportation reauthorization bill to pass, and uncertainties lie in funding. Trade policy may also affect trucking in the U.S., noticeable by border crossing data by Inrix.
The most interesting takeaway was the absence of growth (and even recession) in delays in some major metros. More investigation is needed as to the cause, including population shifts, commuting and car ownership habits, and other economic and demographic data.