

Note: This article contains every spoiler for Season One of Telltale Games’ The Walking Dead.
Developer Telltale’s The Walking Dead was our pick for the best game of 2012. GamesBeat reporter Jeff Grubb describes it as “Regret: The Video Game” because at every point, the adventure throws difficult choices its players, and you’re often left wondering how things might have gone if you’d made a different decision along the way.
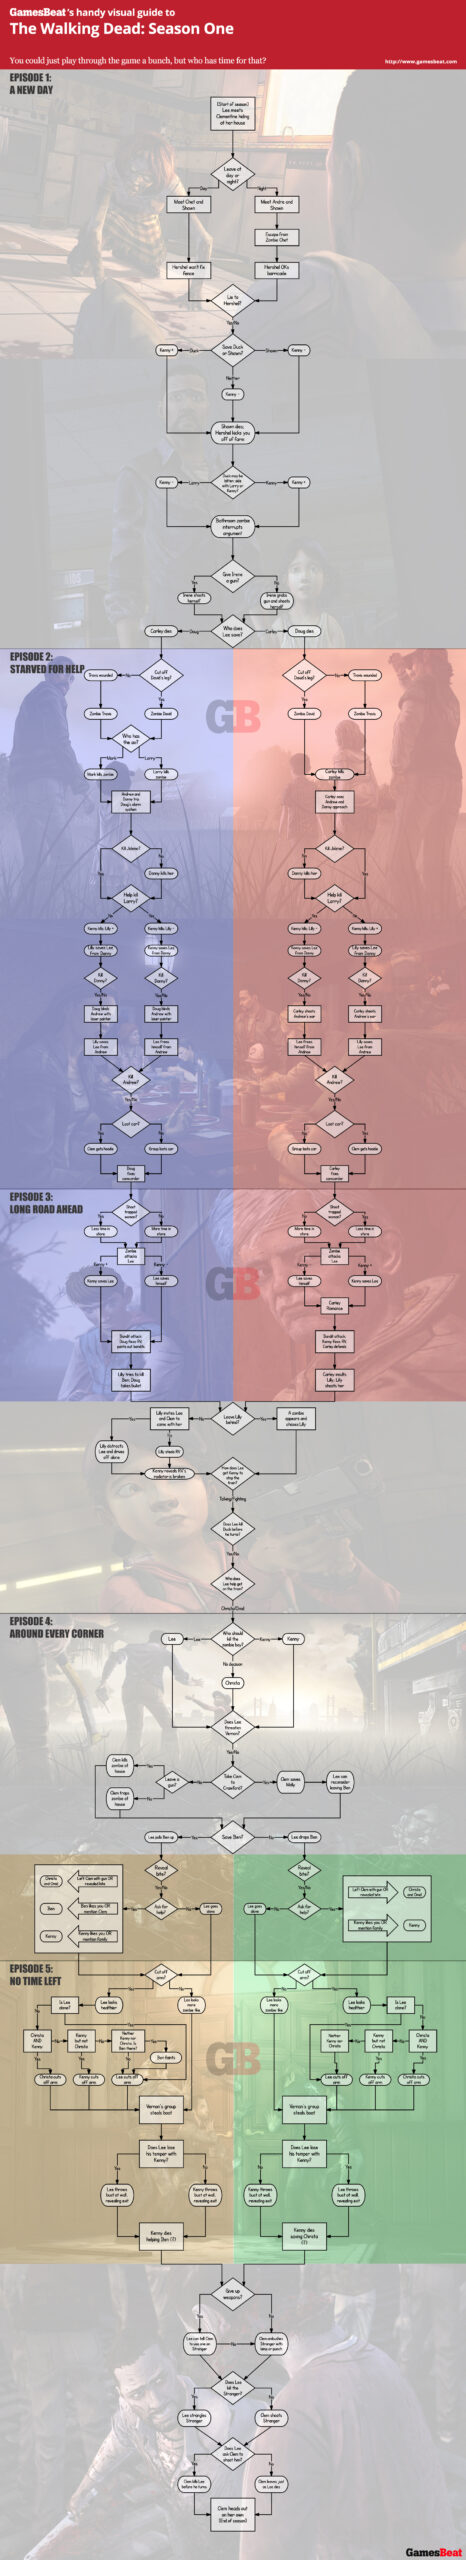
You could certainly find out if you played through The Walking Dead several more times, but we’ll do you one better: The below graph collects all of the choices and outcomes throughout the game into one chart. At first glance, it doesn’t look like much changes at all (because it doesn’t), but the experience of playing through Lee’s and Clementine’s story is not in the boxes on this chart but the lines connecting them.
At the end of Episode 1, did you save Carley because she was good with a gun? Or did you let her die because she couldn’t figure out how to put batteries into a radio? While the plot itself does not change too drastically based on your decisions, the stories we tell about it do.
But if you’re really just curious about the other possibilities, here you go. Click on the image to view it at its full size.
