
In a few posts last week, game jobs champion Amir Satvat shared his best big picture data on the global games industry. He said global gaming’s workforce grew by 4,000 jobs, or about 0.6% in four years.
But from 2022 to 2026, he estimated that North America’s game jobs shrank by 11.5%. Those numbers, based on the best available data, give us a notion of where games employment is growing and where it’s weakening thanks to the net change due to hiring and layoffs, said Satvat, who runs the Always Supporting the Gaming Community (ASGC).
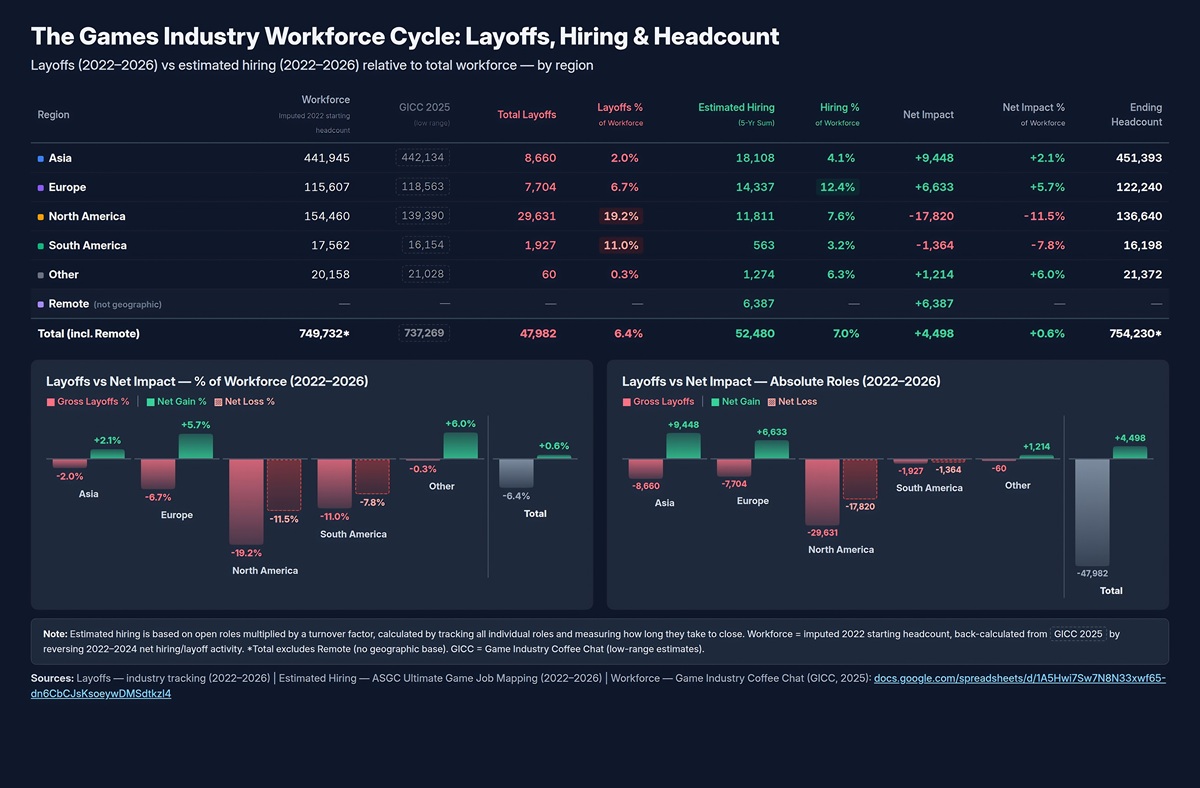
Satvat wrote in a LinkedIn post that the the global games workforce grew modestly, from roughly 750,000 to 754,000, or a net of +0.6%. North America was the exception. It shrank 11.5%. About 48,000 roles were eliminated globally, but roughly 52,500 hires happened over the same period.
“The industry did not collapse. It redistributed,” Satvat said.
But Satvat said many people responded that it felt like it was almost impossible to find a job in gaming. To answer that, he had to look backwards. (Here’s a link to Amir Satvat’s job resources for gaming).

From 2017 to 2022, the games industry was on a hiring tear. Every region with reliable data was growing significantly:
Canada: +48% (ESAC/Nordicity)
UK: +58% (TIGA Survey)
Australia: +59% in a single year (IGEA)
Sweden: +88% (Dataspelsbranschen)
Poland: +150% (Industry census)
Brazil: +210% (Abragames)
Triangulating all available regional data, and staying conservative, the global industry likely added between 150,000 and 250,000 new roles in that five year window, Satvat said. Roughly 30,000 to 50,000 new jobs absorbed every single year. The industry was a sponge. It soaked up graduates, career changers, and new entrants at scale, he said.
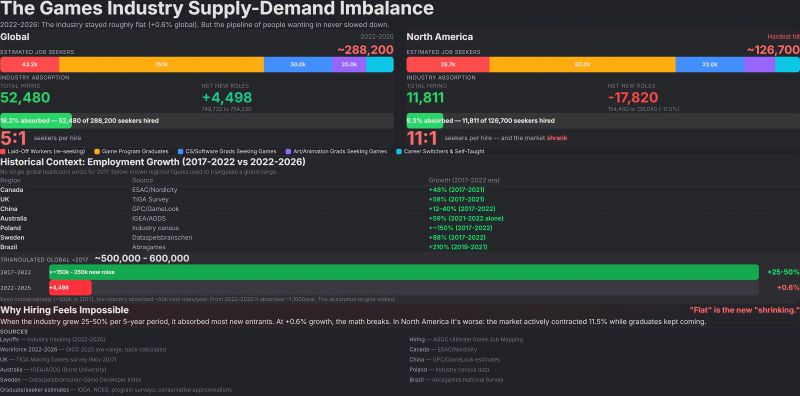
From 2022 to 2026? The industry absorbed about 4,500 net new roles total. Around 1,100 per year. The absorption engine didn’t slow down. It stalled. But the pipeline of people wanting into games never got that memo, Satvat said.
Over 2022 to 2026, an estimated 288,000 people were actively seeking games industry roles globally:
150,000 game program graduates (five graduating classes)
43,000 laid off workers re seeking roles
50,000 CS and software grads targeting games
25,000 art and animation grads pursuing game careers
20,000 career switchers and self taught developers
The math: roughly five seekers for every one hire globally. In North America it is worse. There were 127,000 seekers and just 12,000 hires. That is 11 to 1, in a market that was actively shrinking the entire time, he said.
When the industry grows 25% to 50% every five years, it absorbs most new entrants, Satvat said. The pipeline works. People graduate, people get hired, the funnel clears. Programs expand because demand is real.
But at +0.6% growth, the funnel backs up. Hard. “Flat” is the new “shrinking,” at least for anyone trying to break in or find their next role, Satvat said.
“Understanding why the math feels so brutal right now matters. It is not that you are doing something wrong. The industry went from absorbing tens of thousands of new people per year to barely a thousand, while every university program and bootcamp kept producing at full speed, or even accelerated candidate production,” Satvat said.
The pie is not shrinking. But far more people showed up to the table than the pie can feed right now.
Satvat said he relied on the work done by the Game Industry Coffee Chat (GICC). The group’s low range estimate of the global games workforce is extremely thorough. You can check it out here: https://lnkd.in/eZV2UyhX.
Their figures were calculated in 2025. Based on this, Satvat imputed a 2022 starting headcount by working backwards using hiring and layoff data. That gives us roughly 750,000 people employed in games globally at the start of 2022, he said.
Satvat said he has tracked layoffs meticulously since 2022, using not only public data but arguably the largest source of non public layoff data in the world, built with the help of this entire community helping us understand the total picture.
The result: approximately 48,000 roles eliminated from 2022 through 2026. That is 6.4% of the global workforce. North America was hit hardest, losing 19.2% of its regional workforce. South America lost 11%. Europe, 6.7%. Asia, just 2%.
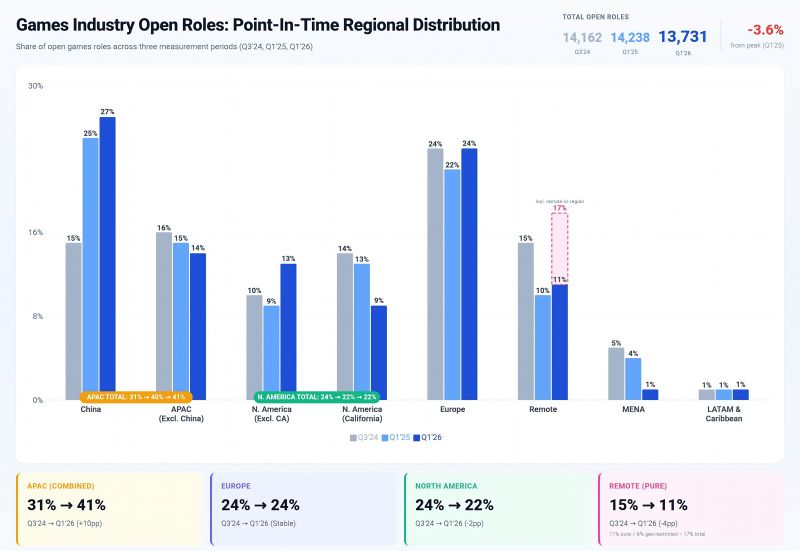
Satvat also tracked every open role in games since 2022, typically spanning 9,000 to 14,000 open opportunities at any given time, and measured the actual turnover velocity to understand how quickly roles are filled and reopened. Based on this data, Satvat said he could estimate total hiring for 2022 to 2026 by region. The industry is not shrinking. It is redistributing. Jobs have moved out of North America and into Europe and Asia.
None of this diminishes what the 48,000 people who lost their jobs went through, he said.
“But the full picture matters, and I hope this helps the community see it more clearly. This is my best attempt to provide accurate data,” Satvat said.
People may ask why these numbers still feel so tough for job seekers, Satvat noted.
“That leads to one more insight. The industry has been essentially employment flat for five years, up less than 1% total,” he said. “But the number of applicants has exploded. People coming out of programs. Career switchers. A growing pool competing for a workforce that has barely moved. The pie is not shrinking, but far more people are trying to get a slice. That is another key part of why it feels much heavier.”
Meanwhile, Satvat wrote that the 2026 games industry layoff projection has risen to 11,580 — up 899 (+8.4%) from the March 24, 2026, forecast of 10,681.
What changed: Confirmed layoffs (actuals) jumped from 3,929 to 4,674 over the past two weeks — a 745-person increase (+19%) — driven by several newly reported studio closures and workforce reductions across Q1. The forecast for the remainder of the year also ticked up slightly from 6,752 to 6,906 (+2.3%), reflecting sustained industry headwinds heading into Q2.
The bigger picture: Since Satvat’s first forecast on January 6 (which projected 8,025 for the year), the projected total has climbed by 44%. The five-year cumulative total (2022–2026P) now stands at an estimated 55,408 layoffs. For context, 2024 remains the peak year at 15,631, but 2026 is already tracking above both 2022 (8,500) and 2025 (9,197) with three quarters still remaining.
Key takeaway: The pace of layoffs is accelerating faster than Satvat’s models initially predicted, with 4,674 confirmed through early April and a rising forecast.
As for where the jobs are, here’s Satvat’s data. This is the most data intensive exercise he does, and it’s now in its third iteration.
Here is the most accurate analysis Satvat can produce of every open role in games by location, mapped by company, with each organization and role individually scraped and thoroughly cleaned.
The forecast numbers
2026 YTD Breakdown (67 Layoff Events, 4,674 Affected)
Regional concentration: North America accounts for 73% of all layoff events and ~72% of affected workers. The United States leads with ~49% of all events, followed by Canada at ~24%. Europe represents ~21% of events. Together, North America and Europe account for 94% of all layoff events globally.
Concentration risk: The top 5 largest events account for approximately 52% of all layoffs, and the top 2 alone represent ~32%. Industry cuts remain highly concentrated around a few large-scale reductions.
2026 Projected layoffs: 11,580, +899 (8.4%) from previous forecast.
2026 Actuals So Far: 4,674 layoffs. Through Jan 1 – 4/6
2022A–2026P Cumulative over past four years: 55,408
The picture in the U.S.
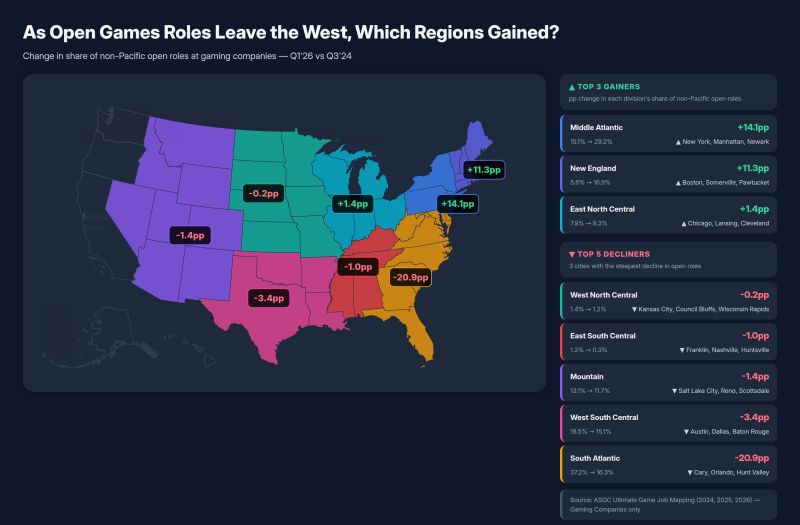
As Open Games Roles Leave the West, Which Regions Gained?
After Satvat’s Q1’26 update on open games industry roles worldwide, many asked exactly which regions gained game jobs. So he filtered for gaming companies only and compared Q1’26 open roles against my Q3’24 baseline.
Of the jobs lost in the U.S. West region, which other regions saw the biggest gains or losses relative to that shift?
Top 3 Gainers:
1) Middle Atlantic +14.1pp (15.1% → 29.2%) – New York, Manhattan, Newark driving the surge
2) New England +11.3pp (5.6% → 16.9%) – Boston tripled its share
3) East North Central +1.4pp (7.9% → 9.3%) – Chicago, Lansing, Cleveland rising quietly
Top 3 Decliners:
1) South Atlantic -20.9pp (37.2% → 16.3%) – Cary, Orlando, Hunt Valley saw the steepest drops
2) West South Central -3.4pp (18.5% → 15.1%) – Austin, Dallas, Baton Rouge losing share
3) Mountain -1.4pp (13.1% → 11.7%) – Salt Lake City, Reno, Scottsdale dipping
The major storyline, at the margins, is clear: the Northeast is pulling open gaming roles away from the West, South, and Southwest in the United States. If you’re looking for work at a gaming company outside the West right now, New York and Boston are where the biggest momentum is.
A very important caveat: this is movement at the margin. Even with these changes, 55% to 60% of open games roles in the United States are still in the West region, so the baseline concentration remains extremely high. This analysis is showing rate of change. The West region is still the dominant location for video games roles in the United States.
Full Q1’26 worldwide breakdown post here, if you didn’t already read it:
https://lnkd.in/eQ5uhr-9
Source: ASGC Ultimate Game Job Mapping (2024, 2025, 2026)